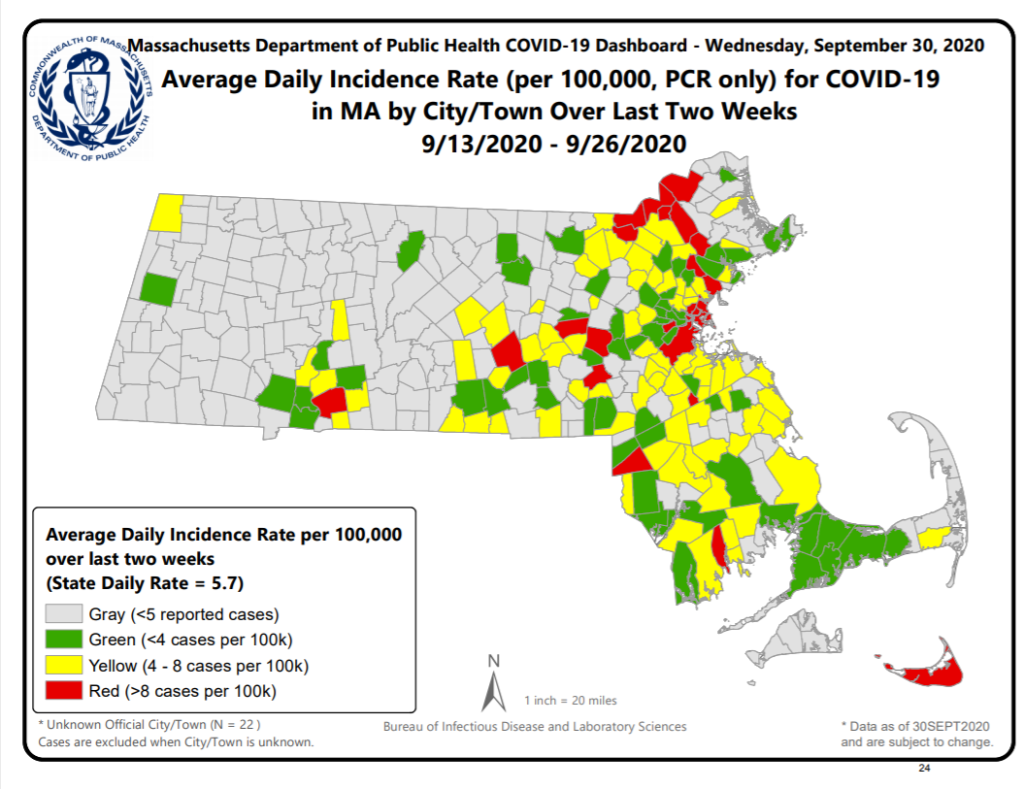
Massachusetts' latest weekly data on the coronavirus pandemic, including the updated community-level risk assessment map, shows 23 communities considered at the highest risk for transmitting COVID-19, up eight from last week.
Among the changes is Boston moving into the red zone for the first time since the state started tracking the town-by-town data, something that Mayor Marty Walsh had been bracing for since last week.
The data, from the Department of Public Health, includes a breakdown of the total number of coronavirus cases in each Massachusetts city and town, as well as the new map and more data.
See the Town-by-Town Mass. Coronavirus Risk Map
The high-risk communities in Wednesday's report are Attleboro, Avon, Boston, Chelsea, Dracut, Everett, Framingham, Haverhill, Holliston, Lawrence, Lowell, Lynn, Lynnfield, Marlborough, Methuen, Middleton, Nantucket, New Bedford, North Andover, Revere, Springfield, Winthrop and Worcester.
Download our free mobile app for
iOS or Android to get the latest breaking news and in-depth coverage of COVID-19.
Eleven communities were added to the red category since last week: Attleboro, Avon, Boston, Dracut, Haverhill, Lowell, Lynnfield, Methuen, Middleton, North Andover and Springfield. Saugus, Tyngsborough and Wrentham dropped off the list.
The map shows the number of cases detected on average each day over the last two weeks in each of Massachusetts' communities. More than 8 cases per 100,000 translates to a high risk and red shading, between 4 and 8 cases per 100,000 is moderate risk and any less than that is low risk.
There are 23 cities and towns shaded red in this map, up eight total compared to last week's map, which included data from Sept. 6-19.

This map shows the average daily number of coronavirus cases per capita in Massachusetts from Sept. 13-26, 2020.
Last week, Boston missed being categorized as high risk by just 0.1 cases per 100,000, following a warning from Walsh that the city was headed for high risk status. But this week's report put its number of cases per 100,000 residents at 8.5.
Walsh said Wednesday that Boston wouldn't be entering Step 2 of Phase 3 of the state's reopening plan on Monday since it was expected to be declared red in the report, which is released Wednesday evenings.
"Being in the red category is something we need to take extremely seriously here in Boston," Walsh said at his Wednesday coronavirus briefing. "It's not unexpected and it's based only on one data point. We've made incredible progress in the last few months and we still have the ability to continue that progress."
However, while state guidance is for communities in red to move schooling remote, Boston has been using a 4% positivity rate as its benchmark for changing course. Boston Public Schools are set to move to a hybrid of in-person and remote learning on Thursday and district officials didn't announce a change to that plan Wednesday night, when the recent percent positivity stood at 0.56%.
A district statement said officials "are monitoring public health guidance and we will only continue with the scheduled phase-in of the hybrid model if it is safe to do so."
A representative for the Massachusetts Department of Public Health noted Wednesday night that Boston is uniquely dense among Massachusetts' communities, with the state's largest population and a high concentration of colleges and universities and other jobs that bring people together. High levels of testing at institutions of higher education has contributed to higher numbers of positive cases as well.
How Massachusetts Measures Hot Spots
Massachusetts has changed over time how it's measured coronavirus metrics.
The color-coded town-by-town data was introduced in August, and the Baker administration announced that the state would focus its strongest COVID-mitigation efforts on towns in the red category. Communities can only move to Step 2 of Phase 3 of Massachusetts' reopening plan, announced Tuesday, if they are not consistently in the red.
Previously, the positive COVID test rate over the prior 14 days had been the standard for measuring hot spots. The Department of Public Health's weekly report still includes that information, along with other metrics like how many tests are being conducted locally and how many cases have been reported locally.
However, some of Massachusetts' smaller towns have taken issue with being categorized based on cases per capita.
New Mass. communities designated by the state's as high risk for coronavirus are reacting to the designation.
They say that, when a town only has a few thousand people, an outbreak in just one household can send it into red, which is determined by 8 cases of COVID-19 per 100,000 residents.
Asked Tuesday why he prefers using cases per capita instead of percent positivity, Gov. Charlie Baker said Tuesday that the latter doesn't take into account that some people get tested repeatedly.
"We have a lot of repeat testers in our data, many of whom are repeating for work-related reasons," Baker said.
The Link LonkOctober 01, 2020 at 09:02AM
https://www.nbcboston.com/news/coronavirus/coronavirus-hot-spots-boston-joins-communities-in-red-on-mass-covid-risk-map/2204239/
Coronavirus Hot Spots: Boston Among 11 New Red Places on Mass. Risk Map - NBC10 Boston
https://news.google.com/search?q=Red&hl=en-US&gl=US&ceid=US:en

No comments:
Post a Comment